Learn How To Spy On Someone Through Their Phone Camera For Free
Are you worried about who interacts with your children or where they are at late night? I feel the same way about my nephew. Whenever my nephew is not in…
TRANSFER PHONE DATA
How To Transfer Data From iPhone To iPhone In 4 Ways
Here’s how to move data from your old iPhone to your new iPhone – you can do it using an iCloud backup by logging in with the same Apple ID…
A Comprehensive Guide On How To Transfer Data From Android To iPhone
You can transfer data from Android to iPhone using the Move to iOS app. Additionally, you can also use the following methods: AnyTrans MobileTrans Android File Transfer Cloud services You…
Meet Our TEAM

Raji Oluwaniyi
Tech Writer
A seasoned technical writer with 7+ years of experience in the tech industry and contributions to esteemed tech blogs.

Kailash Vaviya
Tech Writer
Freelance Tech Writer with extensive writing experience in the tech niche.

Hemant Mendiratta
Senior Editor, Co-Founder
Co-Founder of TechUntold and Founder of Mendiratta Digital with 10+ years of experience in software development.

Adam Hughes
Tech Editor
Ph.D. holder with 25+ years of experience in IT, from coding to leadership. Prolific author and editor across numerous tech sectors.

Mubarak Akingbolu
Tech Writer
Computer Science graduate and specialist in tech and marketing, with writing contributions to platforms like Hacker Noon and Geeky.
To see the rest of the team, go to our About Us page.
MORE ON PARENTAL CONTROL
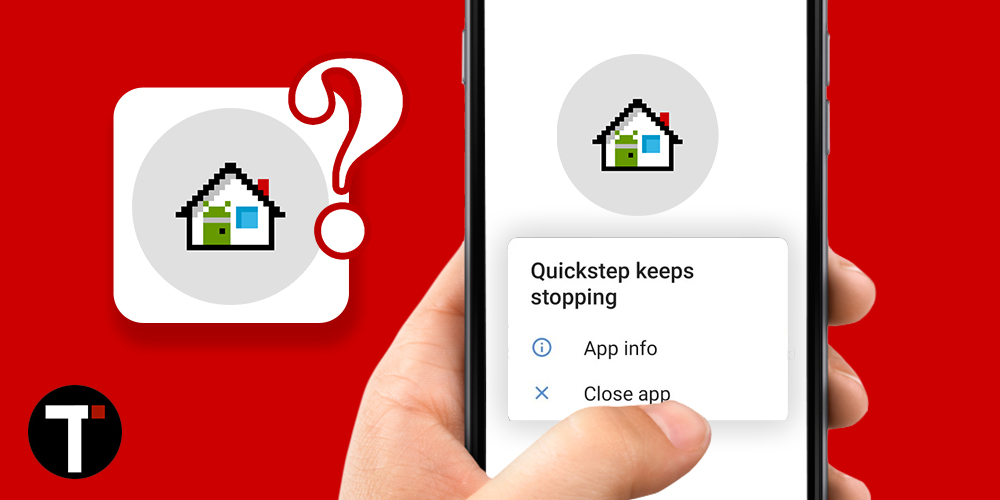
Is Quickstep App A Spy App? Unravel The Truth
Have you ever come across the Quickstep app in your apps list? Are you wondering about its purpose? Do you think it may be a spy app monitoring your activities?…
Is Meta Services A Spy App? Discovering The Truth
Have you ever noticed the Meta Services app either in your app list or running in the background of your Android device? If so, are you worried it might be…

Can A Blacklisted Phone Be Tracked? What You Need To Know
Ever wondered if a blacklisted device can be tracked? Perhaps you lost your phone, blacklisted it for security reasons, and now want to track it, or you purchased a blacklisted…
OUR YOUTUBE VIDEOS
 Subscribe
RESTORE PHONE DATA
iMyFone Review: What Is iMyFone?
iMyFone has a consumer rating of over 3.5 stars for most applications. This indicates that the overall review for iMyFone is positive, and most consumers are happy with the company’s…
Learn How To Restore WhatsApp From iCloud And What To Do If The Recovery Fails
Do you want to know how to restore your WhatsApp from your iCloud backup? As you know, iCloud is Apple’s primary cloud storage service. As such, WhatsApp uses it to…
CLEAN PHONE DATA
5 Best Android Cleaner Apps You’ll Want To Try
Have you ever felt the need to clean your Android phone? I always do, especially with my last device, which had only 32 GB of internal memory. My phone used…

iMyFone Review: What Is iMyFone?
iMyFone has a consumer rating of over 3.5 stars for most applications. This indicates that the overall review for iMyFone is positive, and most consumers are happy with the company’s…

Learn How To Delete Google Search History On iPhone
Do you want to know how to delete your Google search history on your iPhone? No matter which browser you’re using, you can easily erase your browsing history. Learning how…
How To Upload Photos To Google Drive From iPhone: Do It Manually Or Automatically
Here’s how to upload pictures to Google Drive from iPhone – open the Google Drive app, tap Add, then tap Upload. Choose the Photos and Videos folder, then select the…
SOCIAL MEDIA
How To Stop Instagram Suggestions In 5 Ways
Here’s how to disable Instagram suggestions. First log into Instagram on a mobile browser. Then, tap your profile picture at the bottom right to go to your profile and tap…
MORE
In today’s world, where data is king, mastering data analytics is crucial for businesses looking to make smart, strategic choices. This article dives into the transformative power of data analytics…
CapCut, known predominantly for its robust video editing capabilities, conceals within its repertoire a powerful online photo editor that embodies a palette of artistic potential. While initially overshadowed by its…

A business’s success relies heavily on web applications. That’s why several companies nowadays count entirely on web apps to provide a SaaS product for other customers and develop applications for…

iKeyMonitor Review: Is It A Good Spy App For iOS & Android Devices?
Have you ever wondered how to monitor your child’s online activities without invading their privacy? Are you concerned about their online safety? Well, it is okay to be. Like in…
Are you searching for a legal and effective method to monitor your kids’ computer activities and prevent them from using unwanted apps and websites? As children grow older, parents often…
Have you ever wanted to monitor your child’s location without using Google Maps on Android devices or iOS location sharing? Do you want to know if you can monitor their…
I learned from Statista, a provider of market and consumer data, that Instagram is currently the 4th most popular social media platform on the planet. This is no surprise, as Instagram…
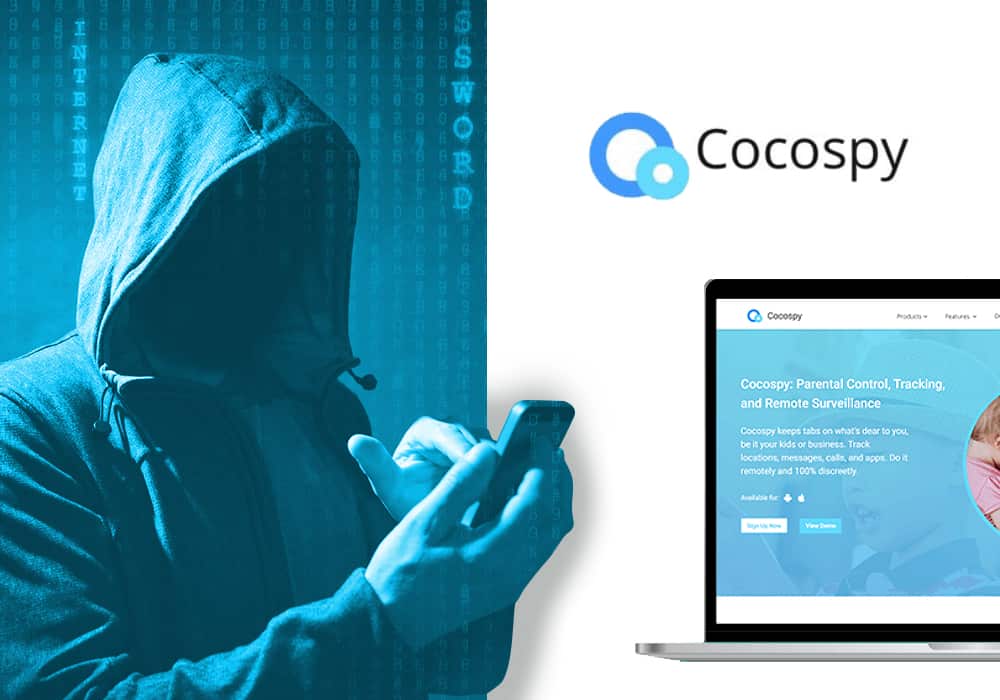
Cocospy Review: Everything You Need About The Parental Control App
Cocospy is a phone spy app you can use to monitor your children as they use the internet. It allows you to track social media activity, call logs, messages, internet…